A practical KPI guide for cocoa factories using enzyme-supported mucilage control, fermentation repeatability, and batch-level precursor development.
Request pricingFermentation is not a craft step at factory scale. It is a controlled biological process with mass balance, heat movement, mucilage behavior, airflow exposure, turning discipline, and downstream drying pressure all connected.
For a cocoa processing factory, the right KPIs make fermentation visible before quality problems show up in cut tests, roaster feedback, or customer rejection notes. Enzymesbase operates as an enzyme supplier for cocoa processing with a practical focus: help production teams manage mucilage breakdown, improve batch-to-batch repeatability, and support consistent flavor precursor development without adding noise to the plant floor.
This guide outlines the fermentation KPIs worth tracking, how they connect to enzyme-supported process control, and what to prepare before requesting a technical quote.
Fermentation variation rarely stays in the fermentation area. It moves downstream as:
A fermentation KPI system gives operations managers a shared language between receiving, fermentation, drying, QA, and commercial teams. Instead of describing a batch as “slow,” “wet,” or “good,” the factory can describe the actual process behavior: drain-down timing, temperature curve, pH trajectory, cut-test distribution, turning response, drying load, and defect exposure.
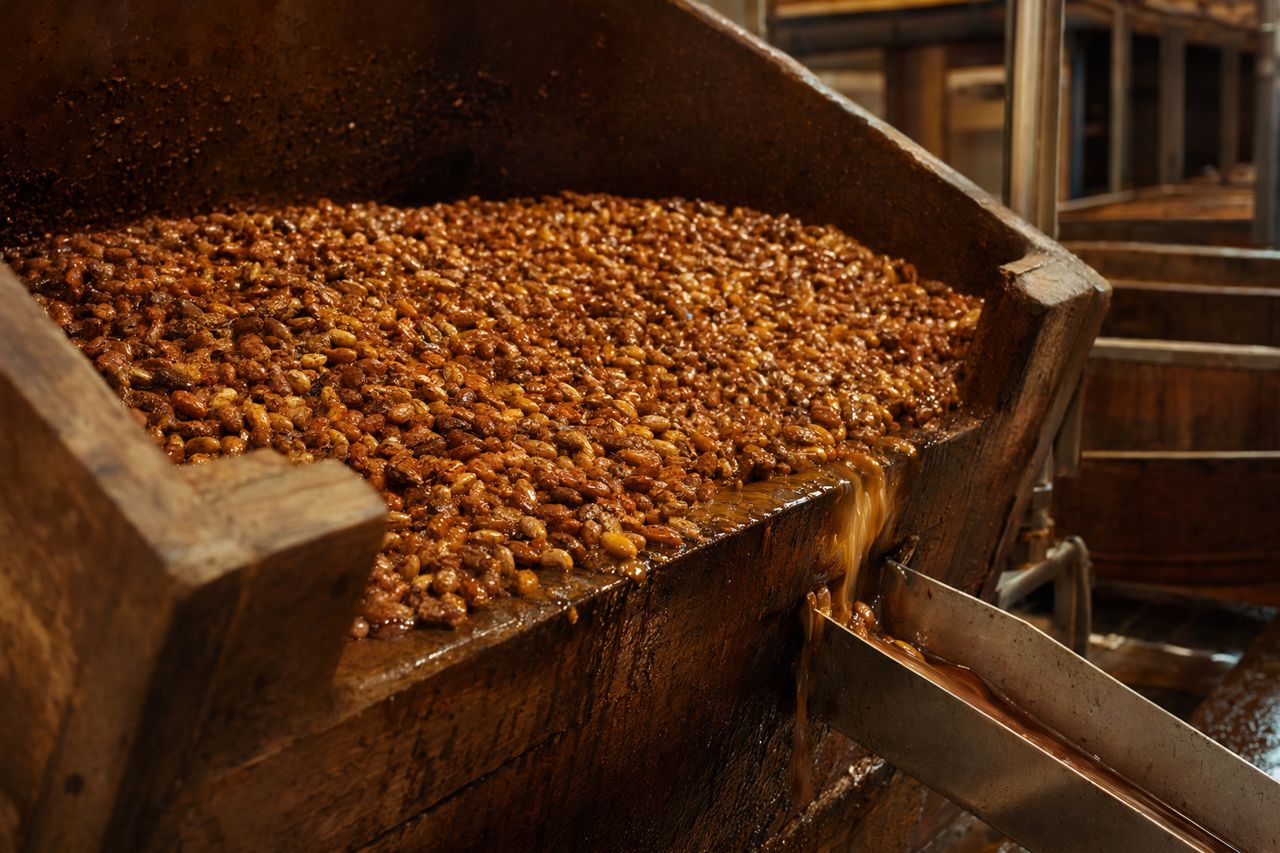
Mucilage behavior is one of the earliest signals of fermentation direction. Excessive mucilage retention can limit oxygen exposure, slow temperature rise, increase handling difficulty, and load the drying stage with avoidable moisture.
Track:
Where enzymes help: enzyme-supported mucilage modification can improve the breakdown of pectin-rich material, helping the bean mass move toward a more predictable fermentation environment. For factories, the operational value is not just cleaner beans. It is better timing, easier turning, and more consistent transfer behavior.
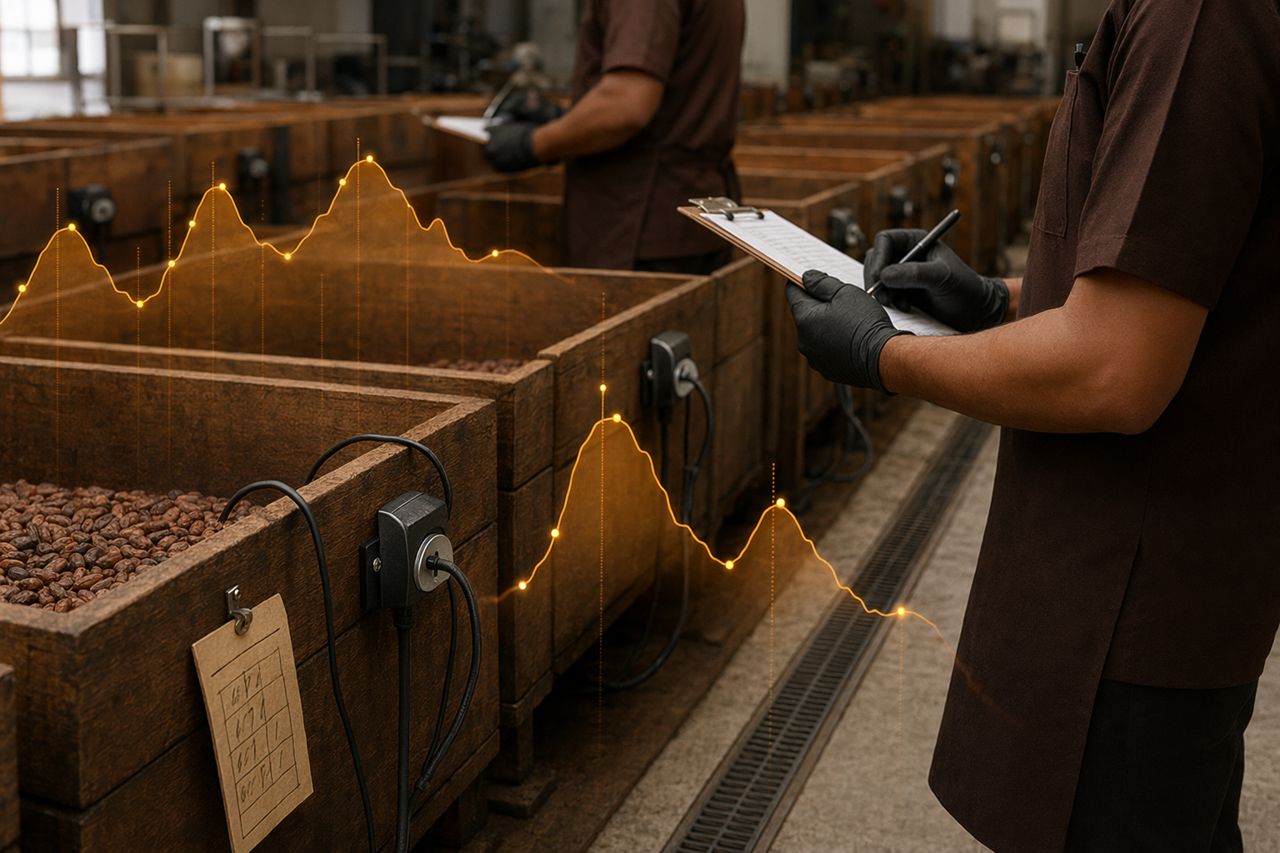
Temperature is a process fingerprint. A healthy fermentation curve should show controlled biological activity, not erratic hot spots or stalled development.
Track:
Operations managers should review temperature curves by batch type, box design, fill depth, season, and bean origin. A curve that rises too slowly may indicate poor substrate availability, low microbial momentum, excess mucilage retention, or insufficient aeration. A curve that spikes unevenly may indicate poor turning distribution or inconsistent load geometry.
Factory teams often discuss acidity as a finished-product issue, but the direction is set during fermentation. Tracking pH trajectory gives early visibility into acid generation, diffusion, and batch maturity.
Track:
The goal is not to chase one universal number. The goal is repeatability for the factory’s bean origin, process design, customer specification, and flavor target.
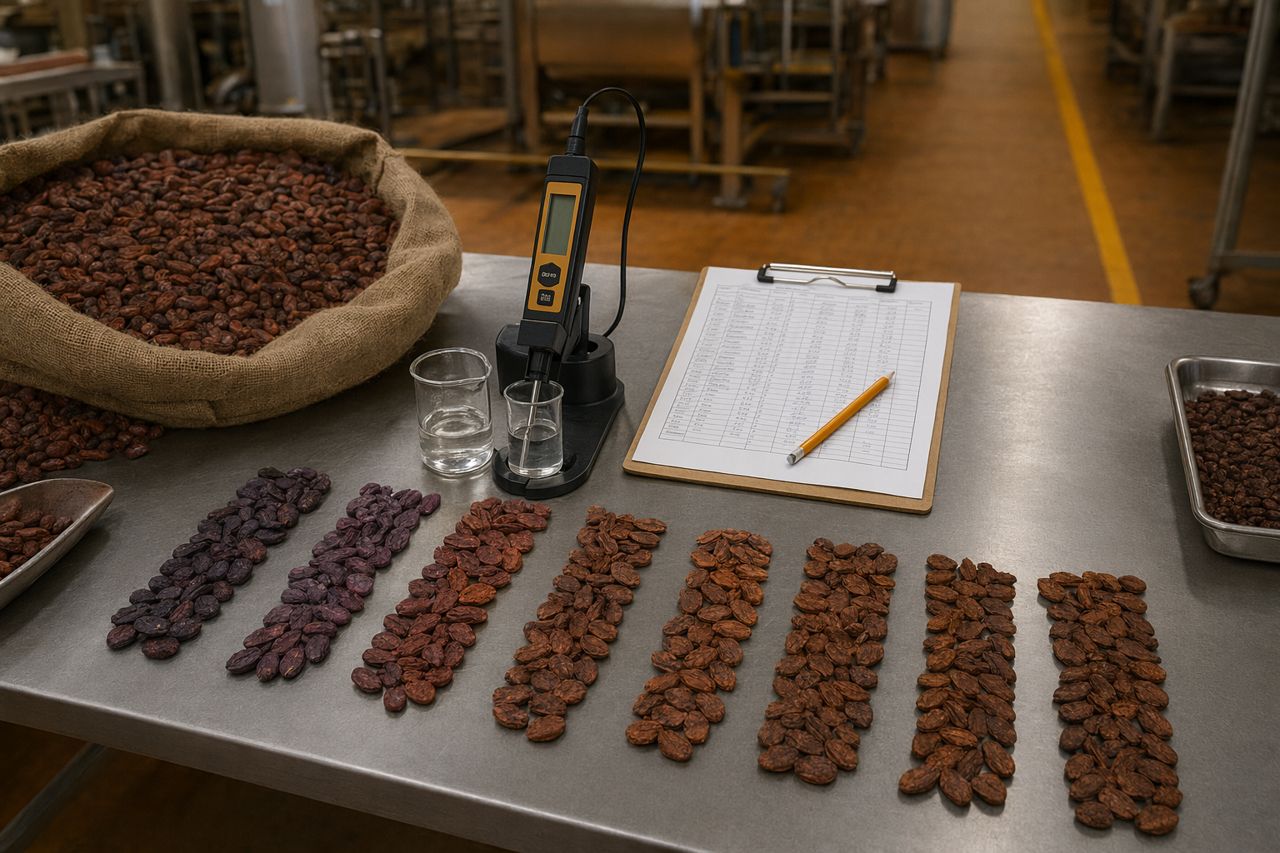
Cut tests are often treated as a final judgment. At factory scale, they should be treated as a batch map.
Track:
Good fermentation KPI discipline links cut-test outcomes back to process conditions. That is where repeatability improves.
Turning is not only a handling task. It resets oxygen exposure, redistributes heat, moves liquid, and changes microbial access to substrate.
Track:
When mucilage is too resistant or bean mass is too compacted, turning takes more effort and produces less process benefit. Enzyme-supported mucilage management can make turns more effective by reducing sticky, uneven movement and helping oxygen reach the bean mass more consistently.
The average fermentation time is less useful than the spread. A factory can run a five-day average and still have too many batches finishing early, late, or inconsistently.
Track:
Reducing spread improves scheduling, drying capacity planning, and customer consistency. This is one of the clearest business cases for tighter fermentation control.
Fermentation and drying are separate process areas, but they are not separate problems. Poor mucilage control increases drying burden.
Track:
A factory should not evaluate fermentation success only at box discharge. If a fermentation program creates drying bottlenecks, the process is not fully controlled.
The real cost of weak fermentation control appears in sorting, blending, customer specification risk, and lost throughput.
Track:
These are executive-level KPIs because they connect fermentation discipline to commercial performance.
Enzymesbase does not treat enzymes as a shortcut around fermentation discipline. Enzymes are a process tool for factories that already care about control.
In cocoa fermentation, enzyme solutions are typically evaluated for their ability to support:
As an enzyme supplier for cocoa processing, Enzymesbase works with operational questions first: What is slowing the batch? Where is the variation entering? Which KPI would justify a process change? What outcome matters most to the plant: throughput, consistency, flavor precursor development, drying relief, or defect reduction?
A useful fermentation dashboard should be short enough to use daily and structured enough to guide decisions.
When testing an enzyme solution, do not evaluate only one attractive metric. Evaluate the whole factory effect:
Cut tests are important, but they are late. If the factory waits for the cut test to understand fermentation behavior, it has already lost the chance to correct the batch.
The same origin can behave differently across box positions, fill depths, and drainage patterns. KPI data should preserve location context.
pH trajectory is more useful than a single isolated reading. Trend, timing, and spread matter.
A fermentation process that pushes variability into drying still costs the plant money. Drying load belongs in the fermentation KPI review.
A useful enzyme evaluation needs a baseline, matched process conditions, and a defined operational objective. Otherwise the trial becomes anecdotal.
Before contacting Enzymesbase, prepare the process details that make a quote technically meaningful:
The more specific the process context, the more practical the recommendation can be.
A cocoa factory does not need more complexity. It needs a fermentation system that is easier to run, easier to measure, and easier to repeat.
When KPIs are clear, enzyme-supported processing can be evaluated by buyer-relevant outcomes: fewer slow batches, tighter cut-test distribution, improved transfer behavior, better drying predictability, and stronger confidence in lot release decisions.
If your team is reviewing mucilage management, fermentation consistency, or batch throughput, Enzymesbase can help define an enzyme solution around your process reality.
Request a quote through the on-site form and include your fermentation format, batch size, target outcome, and current KPI baseline.
Tell us your application and volume — we reply with pricing and lead time.
We have received your message. We will reply by email.